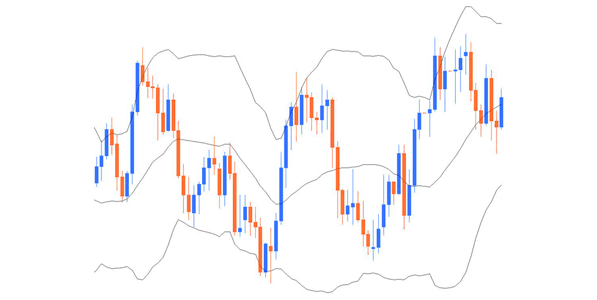
John Bollinger devised the Bollinger Bands which is how they got their name. Bollinger bands are best described as a map of price volatility. The Bollinger Bands charts consist of three parts. The first part is a curved line in the middle. This line is called a Moving Average line. The second part is a lower band and the third part is a an upper band.
The upper and lower Bollinger Bands are a statistical curve that is placed around the price. They represent a certain boundary. In fact the upper and lower bands represent a standard deviation around a moving average. The idea of standard deviation is a statistical concept used to summarize data. In trading softwares, it is called a bell curve.
Bollinger Bands Setting
The most common setting of the bands is (20,2). This means the moving average in the middle of the band is 20-period moving average. Furthermore, it means that the upper and lower bands are two standard deviations from the moving average.This means that the price is 96% of the time between the two bands.
Bollinger Bands are frequently used as indicators in many markets. The bands give the trader an ability to verify whether the price is at an upper range or resistance and whether the price is at a lower range or support. Prices close to Bollinger Bands are very likely to pause its direction and reverse. Noticing this behavior is very useful to binary option traders given that the binary option strike price may be located above or below one of these bands.
The binary option strike price might also be in the middle of the band. You basically need to know where the binary strike price is in relation to the band to properly estimate the degree of likely resistance or support that will happen as time moves forward.
Interpreting Bollinger Bands
The understanding of Bollinger Bands is a three-step process.
- Notice the bands shape. The bands can be narrow or wide. if the band is narrow it is because the market is undecided as to which direction to go. When the range between support and resistance decreases, the bands becomes narrow.
- Take notice of the direction of the bands. The bands can take three directions: sideways, tilted down or tilted up. Sideways bands are on a break before they return to going up or down. If a band is tilted up, it has an upward trend. The opposite is the case when the bands are tilted down.
- Notice the location of the price. The price, shown in candles or bars, are often right of the band. If several candles after each other are located on the upper or lower band, it is an indication that the market is sticky and undecided on its direction.