Dynamic support and resistance levels justify their name and they can change their value due to any reason. Moving averages may be used as dynamic support and resistance levels. Such levels of resistance and support are fundamentally different from the horizontal support and resistance levels. They are constantly changing, depending on past price movements in the market. When using moving averages, there is no need to keep track of these support and resistance levels for the analysis of their behavior in the future. A trader working with moving averages faces only a problem of period choice.
Understanding Dynamic Levels
Dynamic is a key word because these support and resistance levels are not like the traditional horizontal lines. Dynamic levels are constantly changing, depending on recent price movement. Many traders are considering moving averages as key support or resistance levels. These traders buy Call binary options when the price falls and testing moving average and buy Put options when the price rises and touches the moving average.
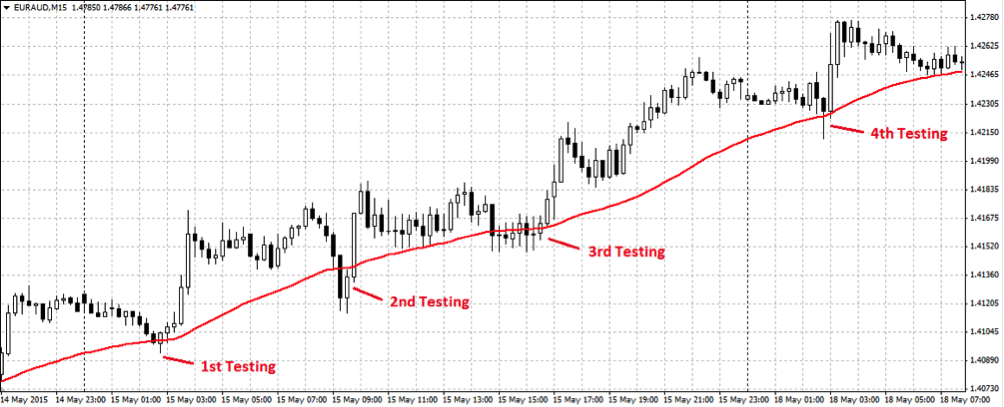
Look at the 15-minute chart of EURAUD pair and imposed EMA with a period of 55 on it. Let’s see whether EMA is good as dynamic support and resistance. It seems that it really works well. Every time the price was close to the line of EMA and tested it, EMA acted as support, and the price is back to normal level. It is amazing, isn’t it?

Multiple Moving Average Testing as Support
But this aspect should be borne in mind – they are a lot like the normal support and resistance lines. It means that price will not always bounce off the moving average. Sometimes it goes a little more before returning to the direction of the main trend. But sometimes the price breaks such resistance. Some traders impose two moving averages, and buy Calls or Puts only when the price reaches the middle of the gap between the two lines.
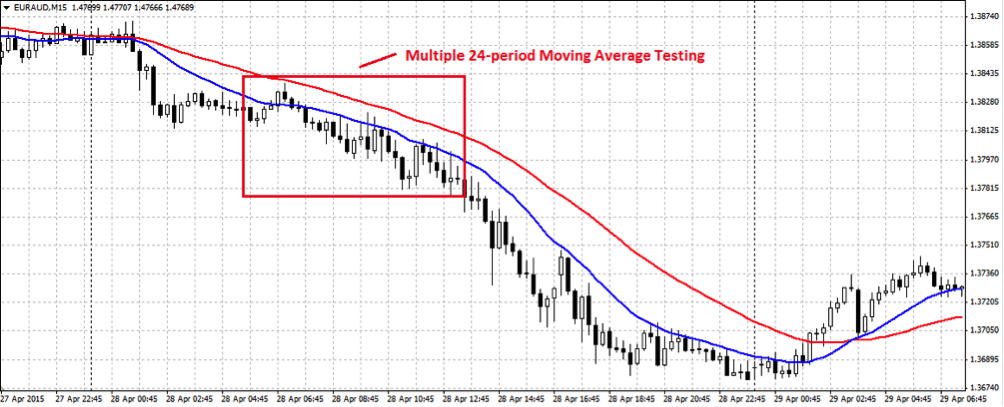
Let’s call this area as zone. Look again at the same 15-minute chart of EURAUD pair, but this time use two EMA – with period of 24 and 55. You can see that price has gone over 24-period EMA a few pips, but then continued to decline.

Multiple Testing of 24-period Moving Average
Some traders use just such a strategy for intraday trading. They are based on the observation that in the same way as normal horizontal support and resistance lines, moving averages and their intersection should be considered as a zone of special attention. Region between the moving averages can be used as support or resistance area.
Moving Averages as Support and Resistance Levels
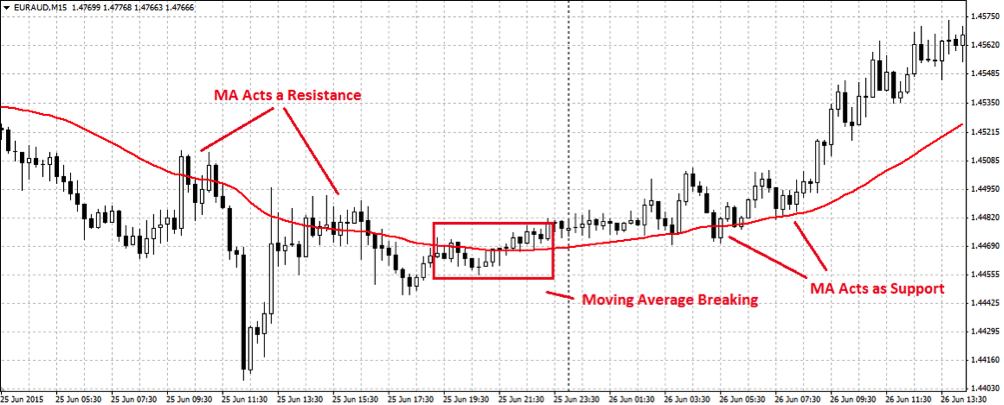
You already know that moving averages can potentially be used as support and resistance levels. Combining several moving averages, you get comfortable zone. But we should remember that these levels can be punched in the same way as any other level of support and resistance. Let’s take another look at the 15-minute EURAUD pair chart coated with its 55 period EMA.

Moving Average Acts as Support and Resistance
The graph shows that 55 period EMA curve serves as a strong resistance level, the rate of EURAUD pair has repeatedly bounced from it. However, in the area marked with a red rectangle, the price finally broke up through this level. Price growth stopped again and became to test EMA with a period of 55, which is now transformed into a powerful support level. Thus, moving averages can also act as dynamic support and resistance levels.
One of the advantages in the use of moving averages is that they vary together with the price on chart and this means that you only need to add moving average to the chart at its no need to look back all time in order to identify potential support and resistance levels. So, you know, that moving average lines form the zone with you are interested with a high probability. The only problem is to determine the parameters moving average using for this purpose.
Bollinger bands as dynamic support and resistance levels
Traders can also use Bollinger Bands as dynamic support and resistance levels. The strategy is based on Bollinger Bands indicator and it is considered as one of the most effective. It helps to determine when investors have to buy Call binary options and when to buy Put. Bollinger Bands strategy is an indicator that predicts trading range (up and down), and the speed of price change.
The width of price corridor is changing constantly. As volatility increases, a corridor expands, it is dangerous to enter the market for trader. When the corridor is narrowing, impulsive movement begins and the trader can enter the market. If the price goes up from a narrow corridor, it is a signal to a Call binary option buying, and if the price comes down from the top line, then you can safely buy a Put binary option.
