harts are among most helpful tools when it comes to binary options trading so it comes in handy to understand them. There are many free charts available online and most brokers offer good quality charts to their traders. There are several types of charts: price break charts, candlesticks, different patterns such as triangles or parabolic patterns… Binary options brokers also feature technical analysis tools and charts as part of their platform.
Free Binary Options Charts
We at Fair Binary Options offer free binary options trading charts that enable traders to find and monitor the historical movements of the currency prices, indices, stocks, and commodities. Traders will find a free Forex chart for nine different currency pairs that will benefit them when trading binary options.
Once traders start trading, they will gain enough knowledge to recognize a trend forming the minute or second it happens. After spotting a trend, they should apply the right strategy whether it is a bullish or bearish trend or any other significant movement in the market. It is strongly suggested to keep this free Forex chart open when trading binary options.
Below readers will find a free stock chart that will help them trading stocks in the binary options market. It is important to notice the history and trend of the stocks traders wish to trade. It can take up to 60 seconds to load the charts. Traders can select various assets in the drop down menu.
Price Break Charts
A very powerful chart tool and technique to use is price breaks, invented by the Japanese. It was not until 1994 the western world noticed them in the publication of Steve Nilson’s book ”Beyond Candlesticks: New Japanese Charting Techniques Revealed”.
Price break charts look like candlesticks without the wicks. Traders often call them bricks or columns. They are footprints telling which direction the sentiment is taking. Like candles, they are usually black for down move and white for an upward move. If a new low has been reached, a black is added and if a new high has been reached, a white is added. If no changes have occurred, nothing is added.
One of the most useful aspects of price breaks charts is the clarity of their rules. There is no room for dispute, due to the fact that they operate on close prices.
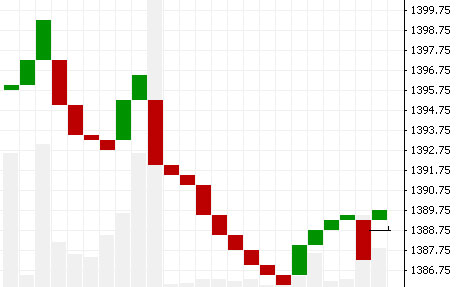
The seemingly simple price break charts can be used in a great deal for technical analysis. From the perspective of sentiment analysis, by registering only the occurrences when a price has established a new high or low, the chart is in effect visualizing the persistence of sentiment. The price’s ability to set new highs or new lows gives us a way to quantify trends besides the usages of traditional trend analysis. From a persistence perspective, the trader can start to quantify how serious a trend is, at what time it is weak and when it has reversed.
Price break charts measure this persistence in an unambiguous way. When using price break charts, traders cannot argue with the price action. The price has either succeeded in maintaining higher or lower or it has not. Furthermore, traders know in advance where a price break chart would be considered strong enough to break a trend.
Candle Patterns
When looking at candlesticks one has to familiarize with the most important ones: Hammer, Doji, Spinning tops, Engulfing candles and Tweezers.
Hammer
Hammer patterns got that name because they look like a hammer. It is recognizable by having a long wick, at times twice the size of the body. The hammer usually appears as a sign of reversal.
Dojis
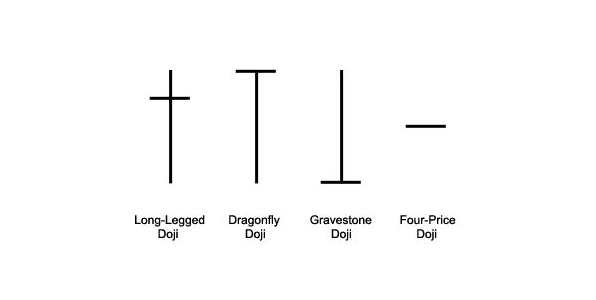
Dojis are very important in determining when the market is showing hesitation and indecision. A doji has no body due to the opening and closing price remains the same or nearly the same.
Spinning Tops
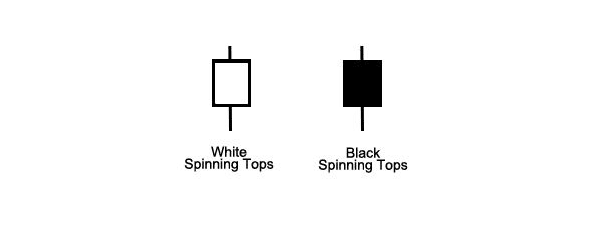
Spinning tops are similar to dojis since they are related to market indecision. This is due to their small bodies.
The Engulfing Candle
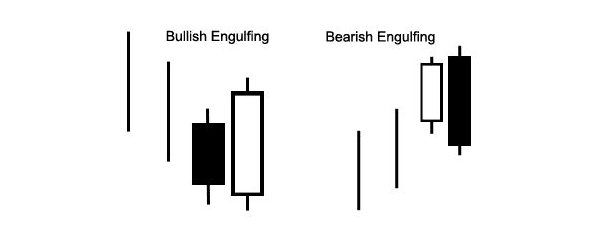
The engulfing candle is often a good indicator of a mood change in the market. It is a pattern of a small candle followed by a very big body of an opposite color hence giving its name engulfing.
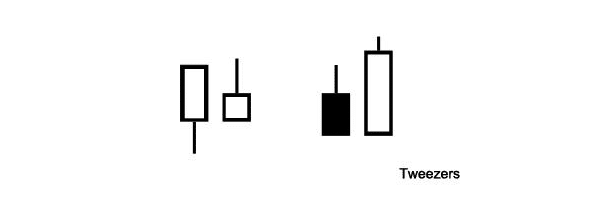
Tweezer
Tweezer candles demonstrate strong support and resistance. When a tweezer is at the bottom, the bears have failed to push the price lower. When tweezer formations are at the top of a candle, it signifies a failure to push the price higher.
Mood Candles
Overall it is worth noticing that the predictability of the emotion signified by a candlestick is related to the time frame. For instance, one-minute candles are less predictive as one-hour candles. To get a full picture of the mood of the market, it is ideal in binary option trading to use four hour candles and one-day candles. We have to add it naturally also depends on what time periods you prefer trading. The two have to match up. It is not handy to look at four-hour candles if you are trading by the hour or by the minute.
Candlesticks
Beginners at binary options trading need to become familiar with price activity, commonly referred to as candlesticks. The expression candlesticks originate from Japan when they were trading rice hundreds of years ago.
Four Parts of Candlesticks
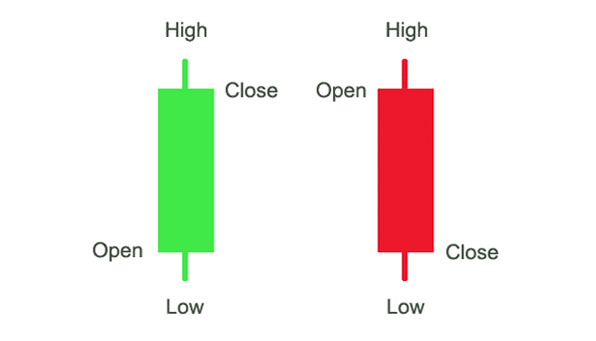
The candlesticks have four parts and the following expressions are used on a daily basis so know them by heart. Wicks represent the lowest and highest points reached. The body consists of two parts, a top and a bottom, which represents the Open and Close prices. These four components make the DNA of price action. A candlestick can represent price activity for almost any time frame. When a trader selects a time period, the candle represents that time frame. Example: 100 candles on a 10-minute time period represents 100 x 10min or 1000 minutes of price activity.
Two Colors of Candlesticks
The most basic feature of candlesticks is its color. The two most common color schemes are black & white and red & green, usually, white and green candles representing bullish activity. Bullish activity is when the price has gone up. The black and red candles represent bearish activity which is when the price has gone down. Simplified:
- A bullish candle is one where the close price is above the opening price
- A bearish candle is one where the close price is below the opening price.
It often happens there are no or very few changes. When this happens, it represents indecision or hesitation in the market. The market is considered to be an ongoing battle between buyers and sellers. If this is the case, the candlesticks are snapshots of who wins that battle.
Patterns for Trading Analysis
The next step is to understand key patterns when the underlying market is selected, and it is time to conduct a pattern analysis. First, choose a time interval for the charts. If trading intraday binary options, a common time frame would be 30-minute. Price action forms many different patterns, but there most important to learn are a triangle, channel, parabolic and Bollinger Bands.
Triangles
When looking at the chart, traders will discover several different triangles. There are ascending triangles, descending triangles and equilateral triangles. Triangles are classic visualizations of a cluster of sentiment. The triangle is a compression of the distance between highs and lows.
The chart can be viewed as a battle between bullish and bearish sentiment is reaching a breakout point. The triangles are essentially preludes to breakouts. When noticing a triangle, the binary options trader should locate the strike prices outside of the triangle and play a breakout. Normally this play would be an out-of-the-money strategy or a deep-out-of-the-money strategy. The triangle is considered a barometer of emotions and suggests that the buyers and the sellers are unable to dominate each other.
The challenge is to recognize when is a triangle being formed and prepare to trade. An ascending triangle is likely to break out going upwards resuming its upward trend. A descending triangle is likely to break out to the downside and then resume its trend downwards. At times symmetrical triangle which can go in any direction occurs, making them less usable for traders.
Parabolic Patterns
The parabolic pattern is an event of strong momentum and is powered by crowd mania, especially when it is forming an apex. When this happens, it is usually a reversal sign.
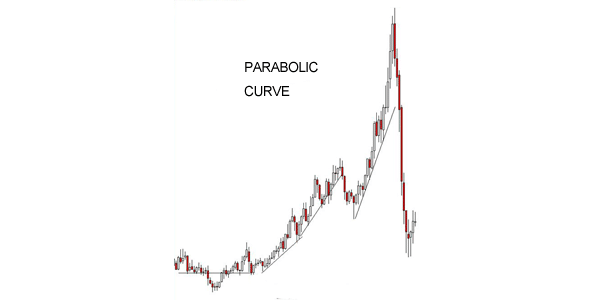
When the parabolic is in its early stages, traders joining the crowd with ATM-strategies are riding on the momentum. The pattern got its name because it follows the shape of a curved path known as a parabolic path. As the trader notices this pattern, it is very likely that the price is at an extreme. The parabolic pattern happens when there is a rush of either buying or selling.
The crowd behavior usually happens when traders see an opportunity of making a profit and the market fear it will miss the opportunity. At the point when the candles reach an angle of roughly 90-degree traders realize it cannot continue forever so the price will pause and then often reverse enabling the first sellers to make a good profit.
